What the implied move tells you before earnings
· Volatility play · 5 min read · OptionsWave Research
The implied move is the size of earnings reaction the options market has priced in, read from the cost of the at-the-money straddle as a share of the stock price. It tells you how large a move a straddle buyer pays for; it does not tell you which way the stock will go, and it does not say the move will happen.
That one number is the starting point of every earnings options idea, so it is worth knowing exactly where it comes from and where it stops being useful.
Where the number comes from
A straddle is one call and one put on the same stock, with the same strike and the same expiry. It gains when the stock moves far enough in either direction, so its price is the market's price for movement, without a view on direction.
To read the implied move before an earnings report:
- Take the earliest listed expiry that includes the first trading session after the report.
- Take the strike nearest to the stock's closing price, where both a call and a put are listed.
- Add the call's ask and the put's ask. That sum is what you would pay for the straddle.
- Divide it by the stock's closing price.
The result is a percentage: the implied move.
A worked example
The numbers below are made up for the arithmetic; they are not a current quote.
| Input | Value |
|---|---|
| Stock close | $100.00 |
| Strike nearest the close | $100 |
| Call ask | $4.10 |
| Put ask | $3.90 |
| Straddle cost | $8.00 |
| Implied move | 8.0% |
The straddle costs 8% of the stock price. At expiry, it is worth exactly what it cost when the stock closes at $92 or $108, 8% from the strike. Between those two prices it loses money, and beyond them it makes money before fees.
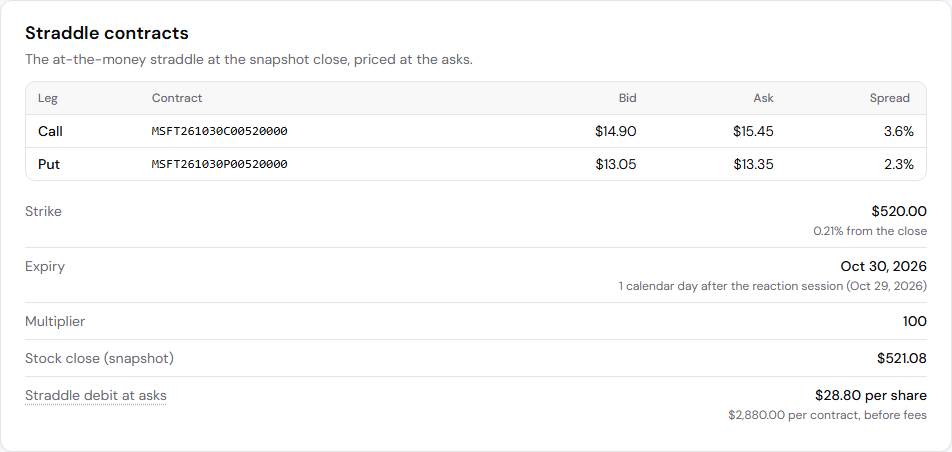
MSFT on the October 22, 2026 close: the $520 call and put asks add up to $28.80 per share, 5.5% of the $521.08 close. That 5.5% is the implied move the scanner compares.
What the implied move is not
It is not a direction. A straddle is priced the same whether traders expect a beat or a miss, so the implied move carries no view on which way the stock goes.
It is not a forecast of the exact move. It is a price. Prices include what option sellers charge to carry the risk, so it is reasonable to expect the implied move to sit somewhat above what a stock typically does, on average, across many reports.
It is not a ceiling. A stock can move two or three times its implied move on a surprise, and it can barely move at all. The implied move says what the market charged for the range, not where the range ends.
It is not the same at every broker or every minute. It is built from quotes, and quotes move. Asks and bids differ, and a wide spread between them makes the number less reliable. OptionsWave uses the closing asks of the session before the report, because that is a price you could have paid, and it says which session it used.
Why a right call on the move can still lose money
Suppose the stock moves 9% on the report and the straddle cost 8%. It looks like the market priced too small a move. Whether the trade made money still depends on three things the implied move does not include.
- When you sell. The 8% break-even holds at expiry. Before expiry the options still carry time value, and after the report that time value usually shrinks fast as uncertainty leaves the price. That drop is called IV crush, and it can take a large share of the gain from a move that only just beat the straddle.
- Where the stock ends, not where it went. A stock can jump 9% in the morning and close up 4%. What the straddle is worth depends on the price when you sell, not the furthest point it reached.
- Costs. Buying at the ask and selling at the bid, plus commissions, raises the move you need.
This is why OptionsWave labels every historical figure "a past move, not option profit". The comparison helps you decide what is worth researching; it does not tell you what a trade would have returned.
Comparing the implied move with past moves
On its own, an implied move of 8% says little. It becomes useful next to what the same stock has done after its own earnings reports.
OptionsWave makes that comparison the same way for every stock:
- Take the stock's last four completed earnings reports.
- For each one, find the reaction session: the report day for a release before the open, the next session for a release after the close.
- Measure the largest distance from the previous close reached in that session, up or down, including the opening gap.
- Average the four.
If that average is above the implied move, the stock is a candidate: an idea to research, not a recommendation. If it is at or below the implied move, the stock is a pass. If any of the four reports has unknown timing or a missing price, the stock is left out of the scan, and nothing older is used to fill the gap.
Two limits matter when you read the result.
Four reports is a small sample. One unusual quarter can carry the average. Look at all four, not only the mean: three quiet reactions and one large one tell a different story from four similar ones.
The largest distance in a session is a generous yardstick. It is usually larger than the close-to-close move, because the stock rarely closes at its furthest point. That is a reason to treat a narrow gap between the past move and the implied move with caution, and to look at where each reaction closed, which OptionsWave shows beside it.
What to check before you research an idea further
- The report time. Before the open or after the close changes which session is the reaction, and which expiry covers it.
- The expiry. It should be the earliest one that includes the reaction session. A later expiry costs more and prices more than the earnings move.
- The spread. If the gap between bid and ask is a large share of the straddle, the implied move from the asks overstates what the market charges, and selling will cost more than the chart shows.
- The four reactions. Read each one, and its close, before reading the average.
- What changed. A company that changed its guidance policy, its business or its size may not react the way it used to.
In short
The implied move is the straddle's price as a share of the stock price. It is the market's price for an earnings move of any direction, built from quotes you can check. Compared with the stock's own past reactions, it gives a first, plain filter for which earnings ideas are worth a closer look, and which are a pass.
A past move is not option profit.
Nothing on OptionsWave is investment advice.