How to calculate the earnings expected move from the straddle
· Volatility play · 5 min read · OptionsWave Research
The quickest way to calculate an earnings expected move is to add the at-the-money call and put of the first expiry after the report, and divide by the stock price. Platforms that show a different number usually start from the same straddle and then scale it, or work from implied volatility instead; the three methods below explain the difference.
The companion article, What the implied move tells you before earnings, covers what the number means. This one is about getting it right.
Method 1: the straddle price
This is the method OptionsWave uses.
- Pick the earliest listed expiry that includes the first trading session after the report.
- Pick the strike nearest to the stock price that has both a call and a put.
- Add the call price and the put price.
- Divide by the stock price.
| Input | Value |
|---|---|
| Stock price | $100.00 |
| Call at $100, ask | $4.10 |
| Put at $100, ask | $3.90 |
| Straddle | $8.00 |
| Expected move | 8.0%, or $92 to $108 |
The range is the strike plus and minus the straddle price: the two prices at which the straddle is worth, at expiry, what it cost.
Ask or mid? The ask is what you would pay; the mid, halfway between bid and ask, is closer to what the market values the options at. With a call quoted $3.90 to $4.10 and a put $3.70 to $3.90, the asks give $8.00 and the mids $7.80. OptionsWave uses the asks, because it compares the move with what a buyer would have paid, and it shows both sides of each quote so you can see the spread.
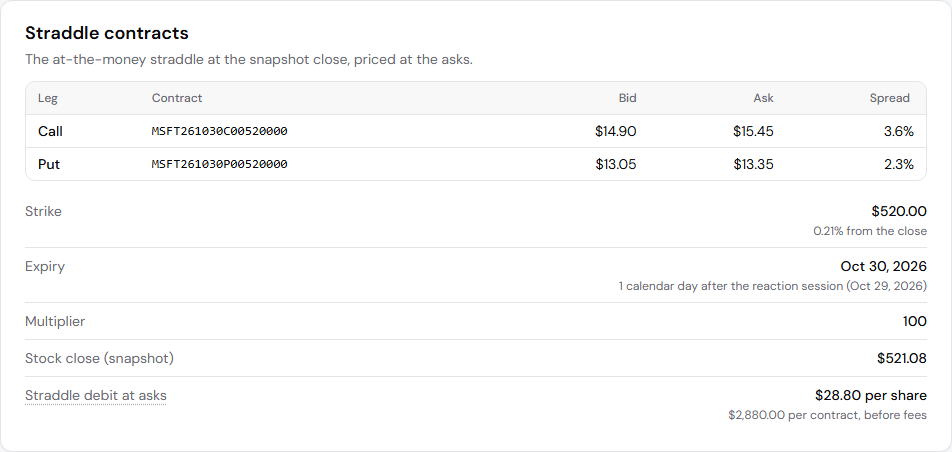
Method 1 on a real chain: MSFT's October 30 straddle at the $520 strike cost $15.45 + $13.35 = $28.80 at the October 22, 2026 closing asks, or 5.5% of the close.
Method 2: the scaled straddle
Some platforms multiply the straddle by a factor, often around 0.85, and call the result the expected move. With an $8.00 straddle that gives $6.80, or 6.8%.
The factor is a convention, not a law. It comes from the shape of option prices: under the standard pricing model, an at-the-money straddle costs about 0.8 times the stock's one standard deviation move to expiry. Scaling the straddle is a way of turning "what the straddle costs" into a statement about the spread of likely outcomes.
Both numbers are fine, as long as you know which one you are reading. If a site shows 6.8% and another 8.0% for the same stock on the same day, they probably agree on the price and differ on the factor.
Method 3: implied volatility
Implied volatility is the annualised volatility that makes the pricing model match the option's price. To turn it into a move to expiry:
expected move = stock price x implied volatility x square root of (days to expiry / 365)
With the stock at $100, implied volatility at 80% and 5 calendar days to expiry:
| Step | Value |
|---|---|
| Days to expiry / 365 | 5 / 365 = 0.0137 |
| Square root | 0.117 |
| 100 x 0.80 x 0.117 | $9.36 |
That $9.36 is the one standard deviation move to expiry under the model. An at-the-money straddle would cost about 0.8 times that, near $7.49, which is how Method 3 and Method 1 connect.
This method needs a volatility figure from your platform, and each platform computes it its own way: from bids, asks or mids, with its own interest rate and dividend inputs. The straddle method needs only two quotes, which is why it is easier to check.
The checks that keep the number honest
The expiry must cover the reaction. For a report before the open, the reaction is the same day; for a report after the close, it is the next session. If the earliest expiry ends before the reaction session, it does not price the earnings move at all.
Use the earliest expiry that covers it. A later expiry also prices every ordinary trading day until it expires, so its straddle costs more and its implied move is larger. The earliest expiry after the report is the cleanest view of the earnings move, though it still includes the days between now and the report.
Mind a strike that is not at the money. With the stock at $101.30 and the nearest strike at $100, the $100 call has $1.30 of value from the price alone. That inflates the straddle a little. Some traders blend the two nearest strikes; OptionsWave uses the nearest strike and names it, so the gap is visible.
Watch the spread. If the gap between bid and ask is a large share of the straddle, the number from the asks overstates the market's price, and the number from the mids may not be a price anyone would trade at. A wide spread is a reason to be careful with the whole idea, not only the number.
Check the timestamp. Option prices drift into the report, and implied volatility usually climbs as the date nears. A number from three days before the report is not the number on the day before. OptionsWave reads the closing quotes of its latest snapshot session, which can be days or weeks before the report, and every row names that session.
Confirm the report date and time. A wrong date moves the expiry and the reaction session. When sources conflict on the timing, OptionsWave leaves the report out rather than guess; when no source states it, the row is flagged as timing unconfirmed.
Which method to use
Use the straddle method when you want a number you can check against two quotes and compare with past moves on the same basis. Use the scaled straddle or implied volatility when you want to think in standard deviations, and remember that they describe the same prices in a different unit.
Whatever you use, write down the expiry, the strike, the quotes and the time. Without them, an expected move is just a percentage.
How OptionsWave compares it
The scanner compares the straddle's expected move with the average of the stock's largest move from the previous close, in the reaction session, over its last four reports. A stock whose past moves average more than its straddle is a candidate: an idea to research, not a recommendation. The comparison is a filter for research; a past move is not option profit, for the reasons in the companion article.
A past move is not option profit.
Nothing on OptionsWave is investment advice.