Post-earnings announcement drift, explained
· PEAD · 5 min read · OptionsWave Research
Post-earnings announcement drift, or PEAD, is the tendency of a stock to keep moving in the direction of an earnings surprise for weeks after the report, instead of adjusting all at once. It is one of the longest-studied patterns in finance, it has become weaker over time, and any rule built on it should be read as a model signal to research, not advice.
The pattern
When a company reports earnings above what analysts expected, its stock usually rises on the reaction day. If prices took in the news completely and at once, the surprise would tell you nothing about how the stock does after the reaction day, compared with similar stocks.
PEAD is the finding that, on average across many stocks, this has not been the case. Stocks with good surprises have tended to keep drifting up for weeks, and stocks with bad surprises to keep drifting down.
What the research found
Ray Ball and Philip Brown first described the effect in 1968, in a study of how stock prices responded to annual earnings. Victor Bernard and Jacob Thomas documented it in detail in 1989 and 1990: after sorting stocks by the size of their earnings surprise, they studied the drift over the following 60 trading days, roughly a quarter, and found that part of it showed up around the following quarter's report.
Their explanation, still widely cited, is that investors under-react to earnings news. They do not fully update on what one quarter implies for the next, so the price adjusts over weeks rather than in a day. Other explanations point to limited attention, especially for smaller stocks with fewer analysts, and to the cost and risk of trading against the pattern.
Where it weakened
A pattern that is widely known and easy to trade tends to shrink. Later studies find that the drift has become much smaller in recent decades, and that among large, liquid US stocks it is weak or hard to find at all (Martineau, 2022). Results depend on the sample, the period and the method. Where it persists, it tends to be in smaller and less followed companies, where trading costs are also higher.
That history matters for anyone using a PEAD rule today. The effect in the old studies is a reason to test the idea, not evidence that it still works at the same size.
How a PEAD rule turns the idea into dates
OptionsWave's rule, pead-v1, is deliberately narrow and fixed. The PEAD strategy page shows it in the app.
- The company beats the estimate. Reported earnings per share are above the analysts' consensus estimate.
- The reaction day closes higher. The first session that reflects the report closes above the session before it. A beat that closes lower is set aside: the market did not confirm the good news.
- Entry at the next open. The model enters at the open of the session after the reaction day, the first regular-session open after the reaction day's close. If the report's data arrives late, a live signal may enter up to two sessions late, flagged as late; later than that, no live position opens.
- Hold for 60 sessions. No stop and no target: the position stays open whatever the price does.
- Exit at the open of session 61.
- One position per stock. If the stock signals again while a position is open, the exit moves to 60 sessions after the new entry.
The rule is long only: it never takes a position on a fall. It trades the shares themselves, not options. And it says only when a position starts and ends; how much to commit and when to cut a loss stay the reader's decisions.
How the rule is measured
Each signal's result is the stock's open-to-open return over the holding period, minus SPY's return over the same sessions, minus 10 basis points for trading costs. Measuring against SPY asks whether the stock did better than simply holding the market over the same days, which is the question PEAD is about.
Beats whose reaction day closed flat or lower, and reports that missed or matched the estimate, are kept as comparison groups. They are never traded, but they show whether the signal's group actually did better than the stocks the rule set aside.
A changed rule is a new rule version stored beside the old one. Every stored result carries its rule version, so the definition behind it can always be checked.
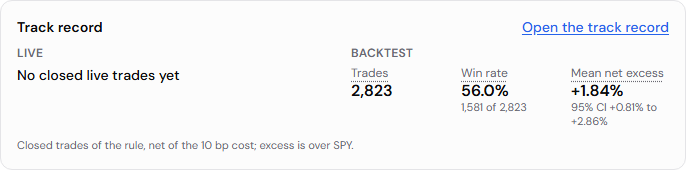
The PEAD dashboard on October 23, 2026: no closed live trades yet, and the backtest of the rule, net of the assumed 10 bp cost, with excess measured over SPY. Past results do not predict future ones.
What a PEAD signal is, and what it is not
A signal is a stock that met the rule's conditions on its latest report, with an entry and exit date. It is a model signal, not advice.
It is not a forecast for that one stock. Any single stock can fall after a beat and a strong reaction day; the pattern, where it exists, is an average across many reports. It is not sized, and it carries no stop, because those depend on the reader's own money and risk.
Questions worth asking of any PEAD result
- What does the comparison group show? A signal group that did no better than rejected beats and misses is not evidence for the rule.
- Is the result net of costs? Reported sizes vary by study, and trading costs can take a large share of them.
- Which stocks drive it? If small, thinly traded stocks carry the result, the trading costs and the capacity are different from the average.
- How long is the record, and does it cover more than one kind of market? A rule measured in one rising market says little about the next.
In short
PEAD is the tendency of stocks to keep moving after an earnings surprise.
It was large in the early research and has weakened since, most of all in large stocks.
A rule like pead-v1 turns it into fixed, checkable entry and exit dates, measured against the market and kept beside the stocks it set aside, so the evidence can be read, not taken on trust.
Each PEAD signal is a model signal, not advice.
Nothing on OptionsWave is investment advice.