Past move versus implied move: what four reports can and cannot say
· Volatility play · 5 min read · OptionsWave Research
Four past earnings reactions can tell you whether the options market is pricing a stock's next reaction well below or well above what the stock has recently done. They cannot tell you how likely a large move is, which way it will go, or what a trade would return, because four is a small sample and a past move is not option profit.
This article explains why OptionsWave uses exactly four, and how to read them.
Why four
A stock's earnings reactions change as the company changes. Its size, its business, how many analysts cover it and how it guides all move over time, and the reactions move with them. Recent reports describe the company that is reporting next better than old ones do.
Four quarterly reports cover about a year. That is long enough to see more than one reaction, and short enough to stay close to the company as it is now.
OptionsWave uses exactly four. If any of the latest four has unknown timing, a missing price or conflicting dates, the stock is left out of the scan: an older report is never pulled in to fill the gap. That keeps every comparison on the same footing, and it means a missing stock is a gap in the data, not a judgement.
What is measured
For each of the four reports, the scanner finds the reaction session: the report day for a release before the open, the next session for a release after the close. It measures the largest distance from the previous close reached in that session, up or down, including the opening gap. The past move is the average of the four.
The implied move is the cost of the at-the-money straddle in the first expiry after the report, divided by the stock price. When the past move is above the implied move, the stock is a candidate: an idea to research, not a recommendation.
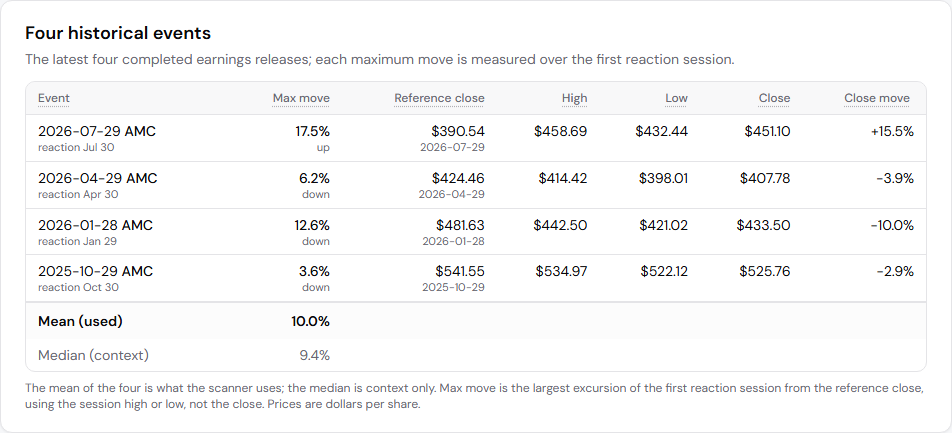
MSFT's last four reactions as of October 22, 2026: maximum moves of 17.5%, 6.2%, 12.6% and 3.6%. The mean of 10.0% is what the scanner uses; the median of 9.4% is shown for context.
What four reports can say
Whether the price is far from recent history. If a stock's last four reactions were 9%, 11%, 8% and 12%, and its straddle prices 5%, the market is pricing a reaction much smaller than any of the last four. That is worth understanding, whatever the reason turns out to be.
Whether the reactions are steady or lumpy. Four similar reactions are a steadier sample than three quiet ones and one large one, where the average hides most of the story. Either way, four observations say little about how the stock will react next time.
Which reports to read. The evidence page lists each report with its date, timing, reference close, high, low and close. An outlier is easy to spot and easy to look up.
What four reports cannot say
A probability. Four outcomes cannot estimate how often a large move happens. Even forty would give a rough answer at best.
A direction. The comparison measures the size of the move in either direction. It carries no view on whether the next one is up or down.
Option profit. The largest move in a session is usually bigger than where the stock closes, and a straddle loses its event premium as soon as the report is out (IV crush). A past move above the implied move does not mean a straddle would have made money.
The next quarter's news. A company that changed its guidance, had a merger or became much larger may not react the way it used to.
How one report can carry the average
The numbers below are made up to show the arithmetic.
| Report | Largest move in the reaction session |
|---|---|
| Q1 | 3.0% |
| Q2 | 4.0% |
| Q3 | 5.0% |
| Q4 | 16.0% |
| Average | 7.0% |
| Median | 4.5% |
With a straddle pricing 6%, this stock is a candidate on the average: 7.0% is above 6%. But three of the four reactions were below 6%, and the median, the middle value, is 4.5%. The single 16% reaction carries the result.
That is not a reason to ignore the stock. It is a reason to read Q4: what happened that quarter, and whether it could happen again. OptionsWave shows the median next to the average for this reason.
How to read a candidate in practice
- Read the gap. A past move a fraction of a point above the implied move is a thin result. A wider gap is a larger difference in this small sample, not proof that it will hold.
- Read all four. Note how many of the four reactions were above the implied move on their own.
- Compare average and median. A large difference means one report is doing most of the work.
- Read the closes. Where each reaction closed shows how much of the largest move held.
- Check what changed. Look for news that makes the next report unlike the last four.
- Check the exit scenarios. They price today's straddle at the close of a repeat of each past reaction, with that day's implied volatility and today's half-spread.
Why the comparison is still useful
A small, plain comparison has one big advantage: anyone can check it. Four dates, four sets of prices and two option quotes are enough to reproduce the comparison; the exit scenarios also need past option quotes and a pricing model.
It does not decide anything for you. It sorts the week's earnings reports into the ones where the price is below the stock's own recent reactions, and the ones where it is not, so the research time goes to the first group.
After each report, OptionsWave also records what the stock did, and shows it as a review. The review shows how often the realized largest move was bigger than the implied move that was priced, for candidates and passes separately. A realized move is not option profit, but over time the review shows whether the comparison sorted reports the way it was meant to.
A past move is not option profit.
Nothing on OptionsWave is investment advice.