How a PEAD signal is timed: entry, exit and the calendar
· PEAD · 4 min read · OptionsWave Research
Under OptionsWave's pead-v1 rule, a signal's planned entry is the open of the session after the reaction session, and its initial planned exit is the open 60 exchange sessions later.
Every date comes from the New York Stock Exchange calendar, so weekends and holidays are skipped, and the planned dates are known the moment the signal appears.
This article walks through the rule step by step, with a worked example. The PEAD explainer covers why the rule exists; this one covers when it acts.
The four dates of a signal
| Date | What it is |
|---|---|
| Report day | The day the company publishes its earnings |
| Reaction session | The first regular session after the report |
| Planned entry | The open of the session after the reaction session |
| Planned exit | The open of the 60th session after the planned entry |
The reaction session depends on the report's timing. A report before the open reacts the same day; one after the close reacts the next session (why timing matters).
The signal needs two things: reported earnings per share above the analysts' estimate, and a reaction session that closes above the previous close. Beats whose reaction session closes flat or lower, and reports that miss or match the estimate, are kept as comparison groups and never traded.
The planned entry is the next open after the reaction session's close. Waiting for that close is the point: the rule only acts once the market has confirmed the beat.
The planned exit is 60 sessions after the planned entry, at the open. Counting the entry as session 1, that is the open of session 61.
A worked example
Take a hypothetical company that reports after the close on Thursday, November 5, 2026, beats the estimate, and closes higher the next day.
| Step | Date |
|---|---|
| Report, after the close | Thursday, November 5, 2026 |
| Reaction session, closes higher | Friday, November 6, 2026 |
| Planned entry, at the open | Monday, November 9, 2026 |
| Planned exit, at the open | Friday, February 5, 2027 |
Between the entry and the exit, four weekdays are exchange holidays and are not counted: Thanksgiving (November 26), Christmas Day, New Year's Day and Martin Luther King Jr. Day (January 18, 2027). Counting weekdays without skipping those holidays would put the exit on Monday, February 1, four sessions early.
Had the same company reported before the open on November 5, the reaction session would be November 5, the planned entry November 6, and the planned exit February 4, 2027.
No stop, no target
The rule has no stop and no profit target: the position stays open whatever the price does, because that is how the drift was measured. The only thing that changes an open position's exit is a new signal on the same stock, described next.
How much to commit, and whether to cut a loss, stay the reader's decisions. A signal is a model signal, not advice.
When the stock signals again
The rule holds one position per stock at a time. If the stock signals again while a position is open, which happens when its next report also beats and closes higher within the 60 sessions, no second position opens. Instead, the exit moves to the new signal's planned exit.
That keeps a stock that keeps beating in the model, without doubling it.
When the data is late
Sometimes a report's earnings figure reaches the data later than the market did. A trader could only act once the figure was known, so the rule judges a live signal by when the figure was first stored.
- If the first usable open is up to two sessions after the planned entry, the live signal still enters, at that later open, and is flagged as late. Its exit stays on the original planned date.
- Later than that, no live position opens, and the signal is recorded with the reason.
The historical record of the rule is measured on the planned dates. The late-data rule exists so the live signals never use information before it was available.
How the result is measured
Each signal's result is the stock's return from the entry open to the exit open, minus SPY's return over the same two opens, minus a fixed assumed round-trip cost of 10 basis points (0.10 percentage points). Actual trading costs can differ. Measuring open to open matches the dates the rule names; subtracting SPY asks whether the stock did better than holding the market over the same sessions.
Where to find the dates
On the PEAD dashboard, each stock shows its trade state and its latest release. On a stock's page, the current-trade panel shows the entry and the planned exit. Its releases table shows each release date, the timing, the EPS surprise, the reaction-day return and the evaluation, so the beats the rule set aside sit beside the signals.
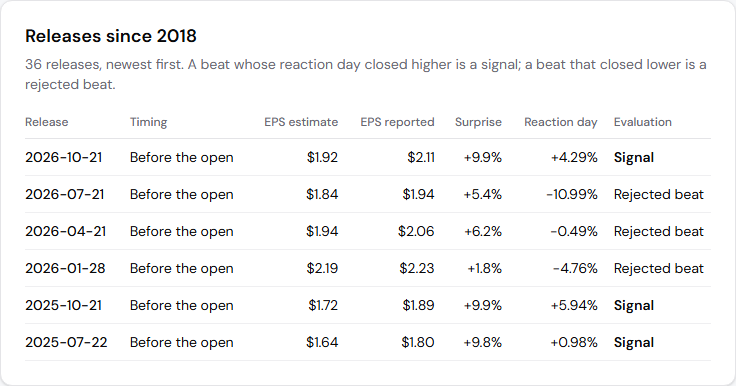
Danaher's releases: the October 21, 2026 report before the open beat the estimate and closed 4.29% higher that day, so it is a signal. Beats that closed lower are kept as rejected beats.
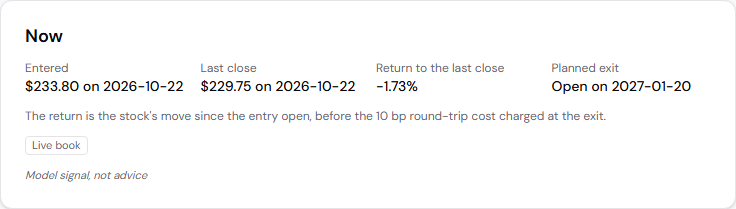
The same signal's dates: entry at the October 22 open, the session after the reaction, and a planned exit at the open on January 20, 2027, 60 sessions later. A model signal, not advice.
In short
A PEAD signal is four dates: the report, the reaction session, the planned entry at the next open, and the planned exit 60 exchange sessions later. The rule never adjusts them for price; a late live entry keeps the planned exit, a new signal can extend it, and live signals are judged only on information that was available at the time.
Each PEAD signal is a model signal, not advice.
Nothing on OptionsWave is investment advice.